Qty Matrix – Date
This is a Club Prophet Executive Report v4 – Power BI or PBI.
Note: Samples are using demo data and do not reflect real-world data.
Qty Matrix – Date
Matrix reports provide a unique feature to drill down thru data by both Columns and Rows. This report provides the quantity of items, the description of a given group in a given time frame, and will allow you to drill down thru different levels of description (GL, Sale Category, Product) and dates (Year, Month, Week, Day).
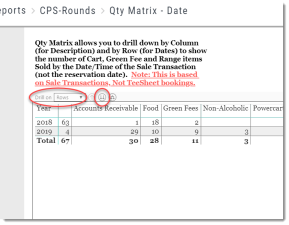
The top-level of the sample report above is by GL Description and shows the number of items sold in the Date Range filter by Year.
To see the Matrix control options, click the report visual.
This will display the usual Drill Up, and Down Arrow controls, but notice with matrix-type visuals, you’ll find controls for Drill On: either the Rows or Columns drop-down menu.
Stepping thru the Rows drill-down.
With the Drill On set to Rows, click the Double Down Arrow to Go to the next level: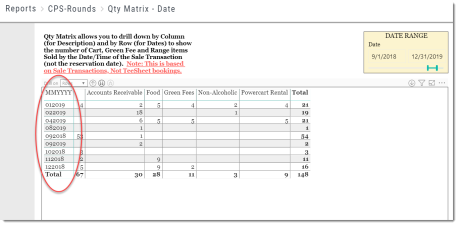
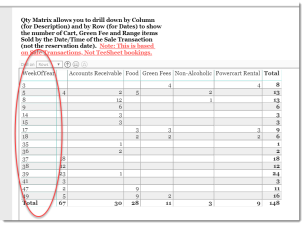
The report now drills down from YYYY to MMYYYY for the quantity of items sold for each GL by Month.
Repeating the drill down action, you can drill down to the week of the year and then to individual days and dates.
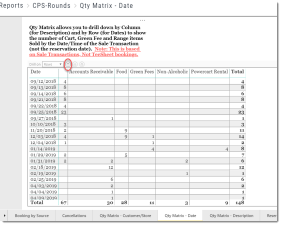
The report now drills down to the date level with counts for each GL. Note the Drill Down Arrow is now disabled as this is the lowest level in the hierarchy. You can however, drill up.
To show the Columns - Drill Down Arrow, you drill up back to the top level and click the Drop-Down Arrow for the drill on feature:
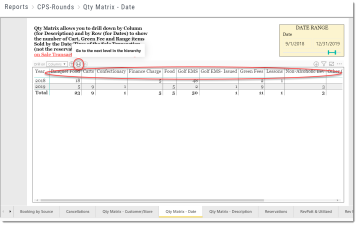
Clicking the Drill Down Arrow icon, select Columns, and drill down.
You can now drill down to the Sale Category level and see the Qty for the Year.
Drilling down again will go the actual Item description.
Of course, you can mix and match Row and Column drill-down! So, by drilling down on Columns to the Sale Category level and the Columns to the WeekOfYear level, you can, for example, compare items sold by Sale Category for each Week of the Year.
FILTERS
In addition to the Date Range slicer, the right-side menu of this report provides various Filters to allow you to filter the data in several ways. Click any of the Filter fields for basic and advanced filter and search options.
Tips
- Filters which are the gold back color controls on the report allow you to pick from a list. Hold down the Ctrl key on the keyboard to select multiple items.
- If you want to search for a particular value, use the filters in the right pane menu. They will have a search box in addition to a list of the items.
- Use the Advanced option in the right menu panel for advanced search options.
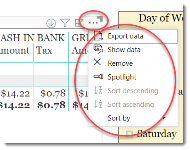
- Use the three dots […] in the top right of a visual for more options like Export data.
- Use the Help button to open the user guide for any given report
 .
.


